
Social preview bugs have a uniquely annoying feedback loop:
- Change a few
<meta>tags. - Deploy the site.
- Paste the public URL into one or more platform-specific validators.
- Discover that the image is cropped, the description is stale, or a required tag is missing.
- Repeat.
That felt backwards. I wanted to inspect the page where I was already working, compare every important social card at once, understand the metadata behind them, and fix problems before deploying anything.
So I built an open-source OpenGraph Preview canvas for the GitHub Copilot app. It works with public URLs and localhost, and it turns a passive preview into an agent-driven workflow.
See it in action
The video walks through the end-to-end flow in about six minutes: browse a page inside the canvas, inspect its social cards, review the raw metadata, and turn a diagnostic into a ready-to-run Copilot task.
One canvas, four working modes
The canvas has four tabs, but they all operate on the same URL and shared state. Navigating in Browse refreshes Previews, Raw metadata, and Diagnostics automatically.
The walkthrough uses aspire.dev as one consistent target, so each view shows a different layer of evidence for the same page.
Browse the live page
The default tab is a real, interactive page view. The address bar accepts a full URL, a bare domain, or a local address such as localhost:4321.
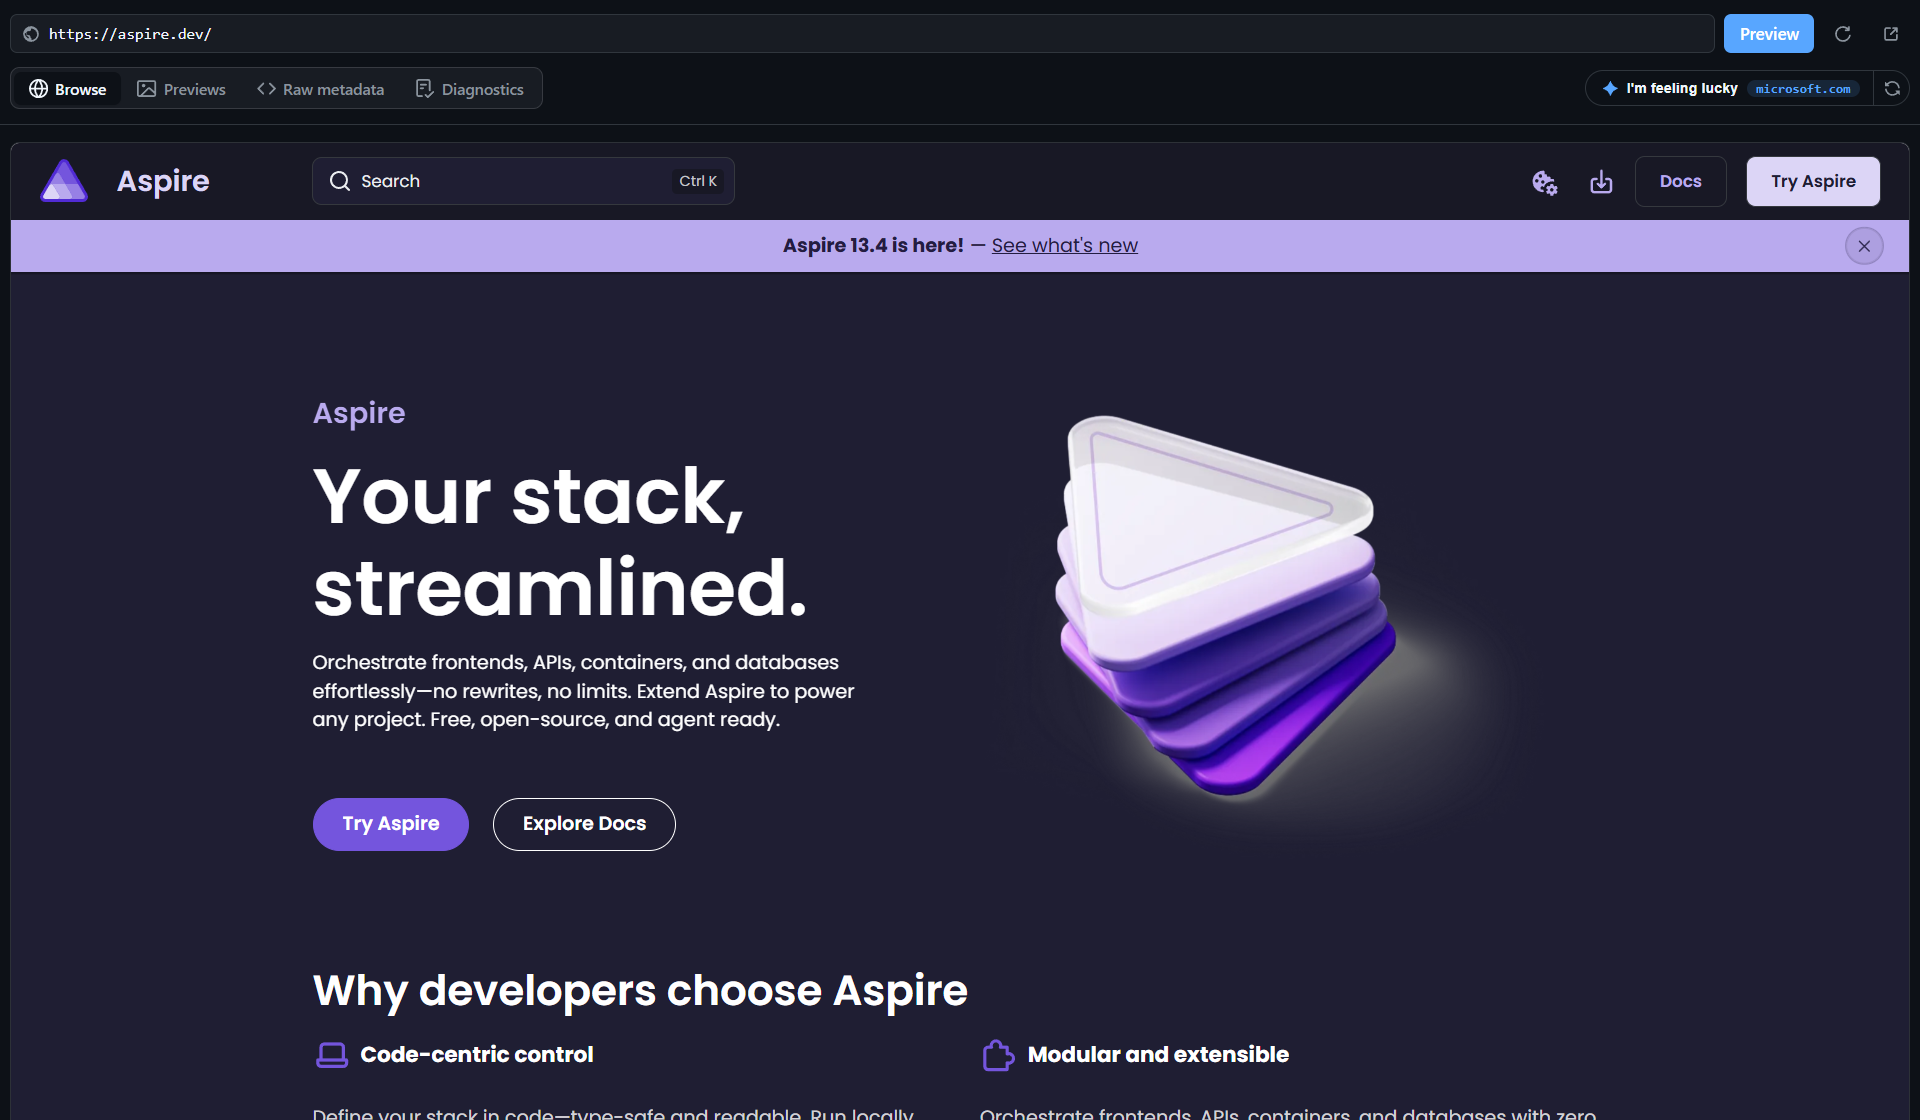
This is not a static screenshot. The page is fetched through the extension’s loopback server and rendered in a sandboxed frame. Internal navigation updates the address bar and reruns the metadata pipeline. Reload and open-in-browser controls are available beside the main Preview button, while the “I’m feeling lucky” control offers a quick sample site.
The practical value is continuity: I can browse to the exact route I care about without leaving the canvas or copying URLs between tools.
Compare nine social renderings
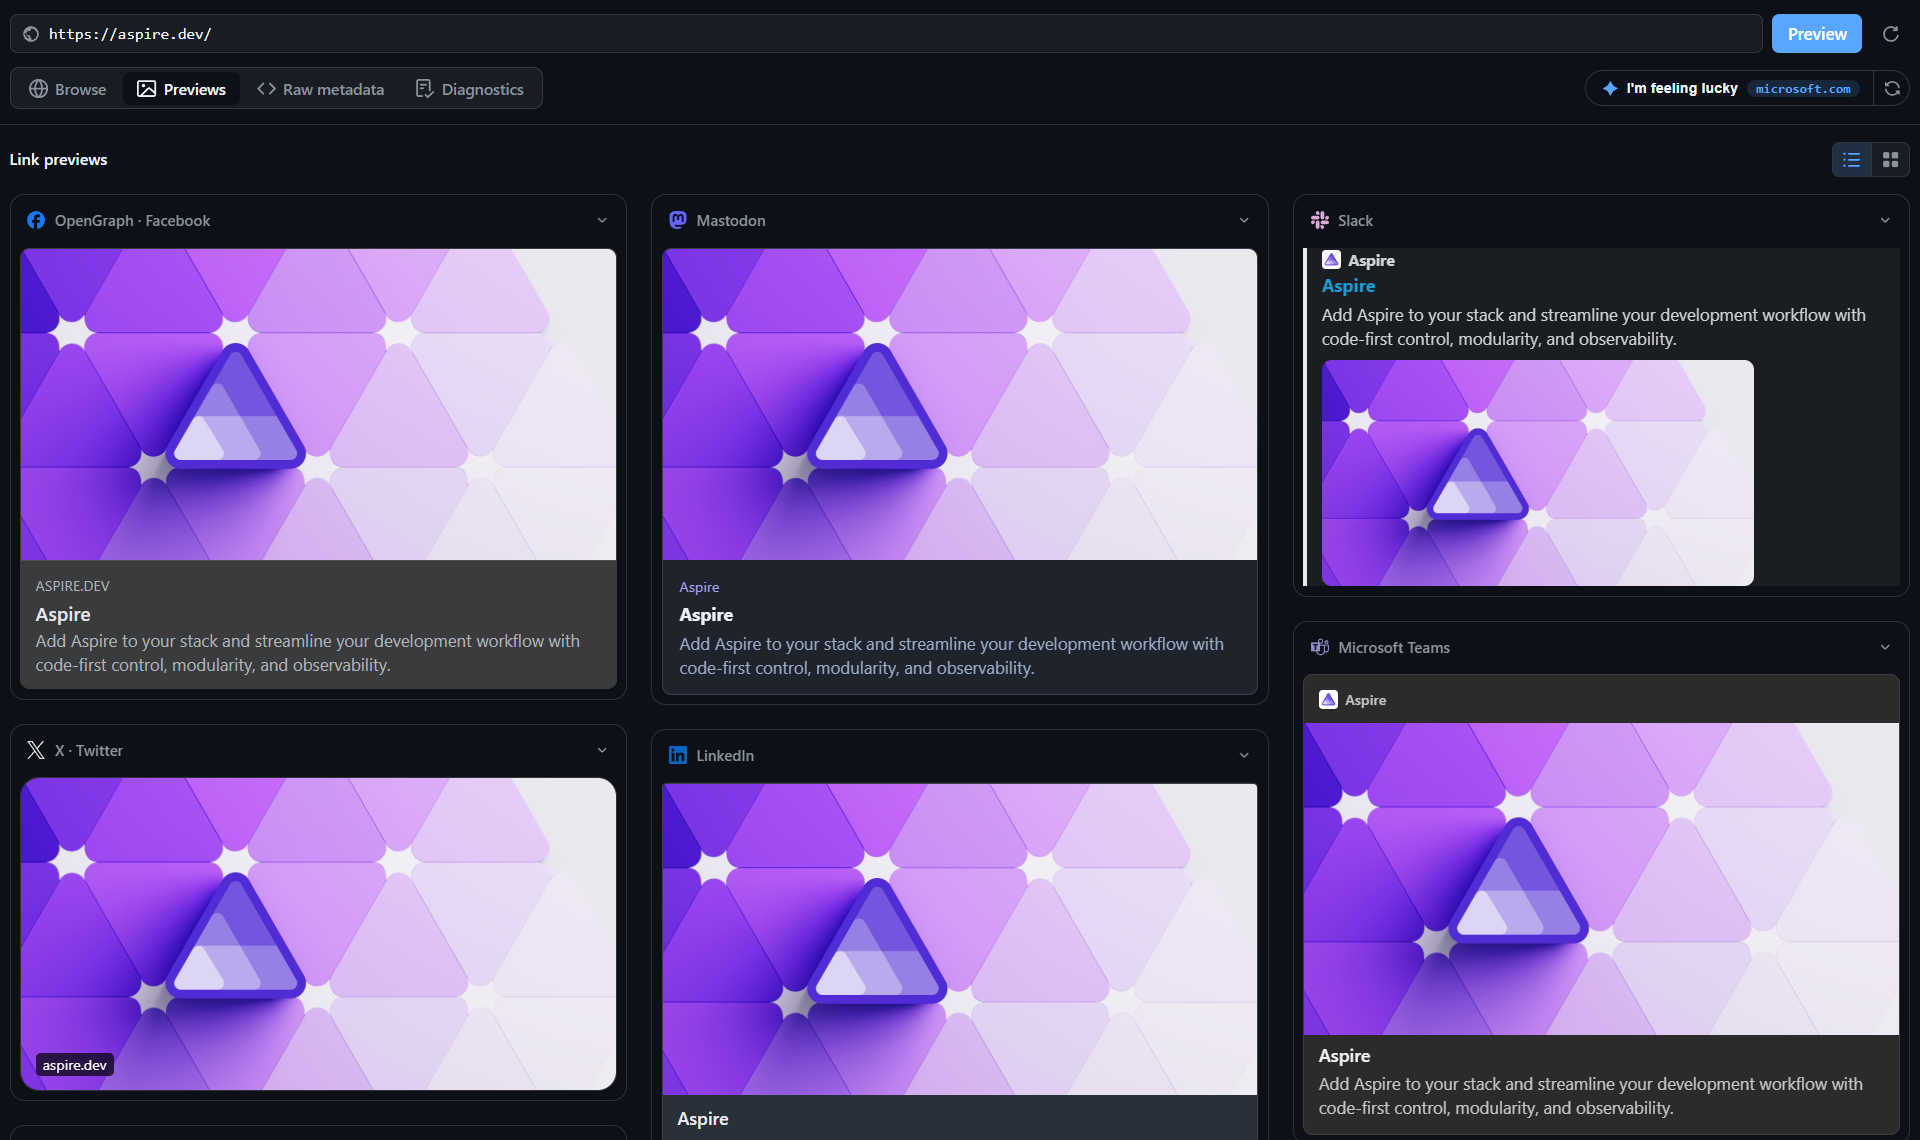
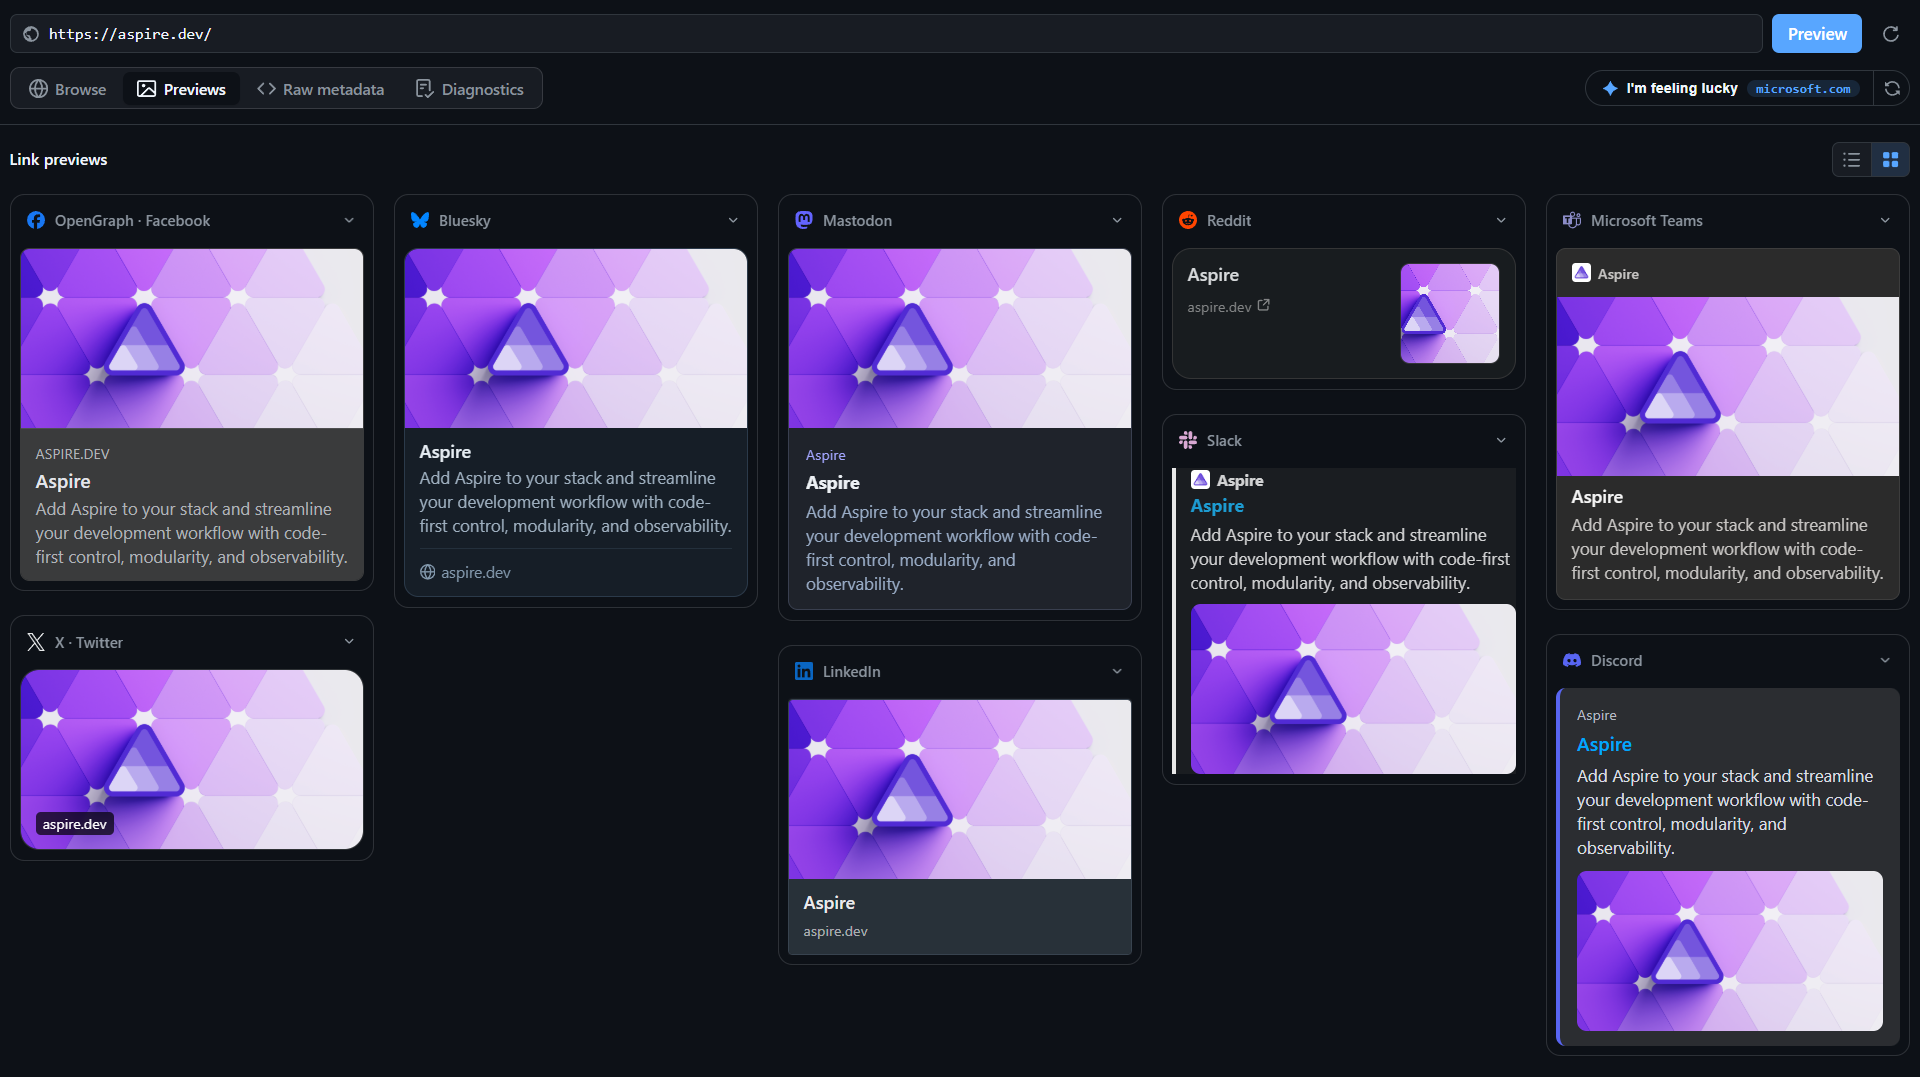
The Previews tab renders the same metadata as:
- OpenGraph / Facebook
- X
- Bluesky
- Mastodon
- Slack
- Microsoft Teams
- Discord
The larger list layout preserves detail, while the compact grid makes cross-platform differences obvious at a glance.
Inspect the raw evidence
Pretty cards are useful, but debugging requires evidence. Raw metadata is grouped into OpenGraph, Twitter / X, other metadata, and icons or links. Values get useful formatting, every row has a copy action, and the entire payload can be copied as JSON.
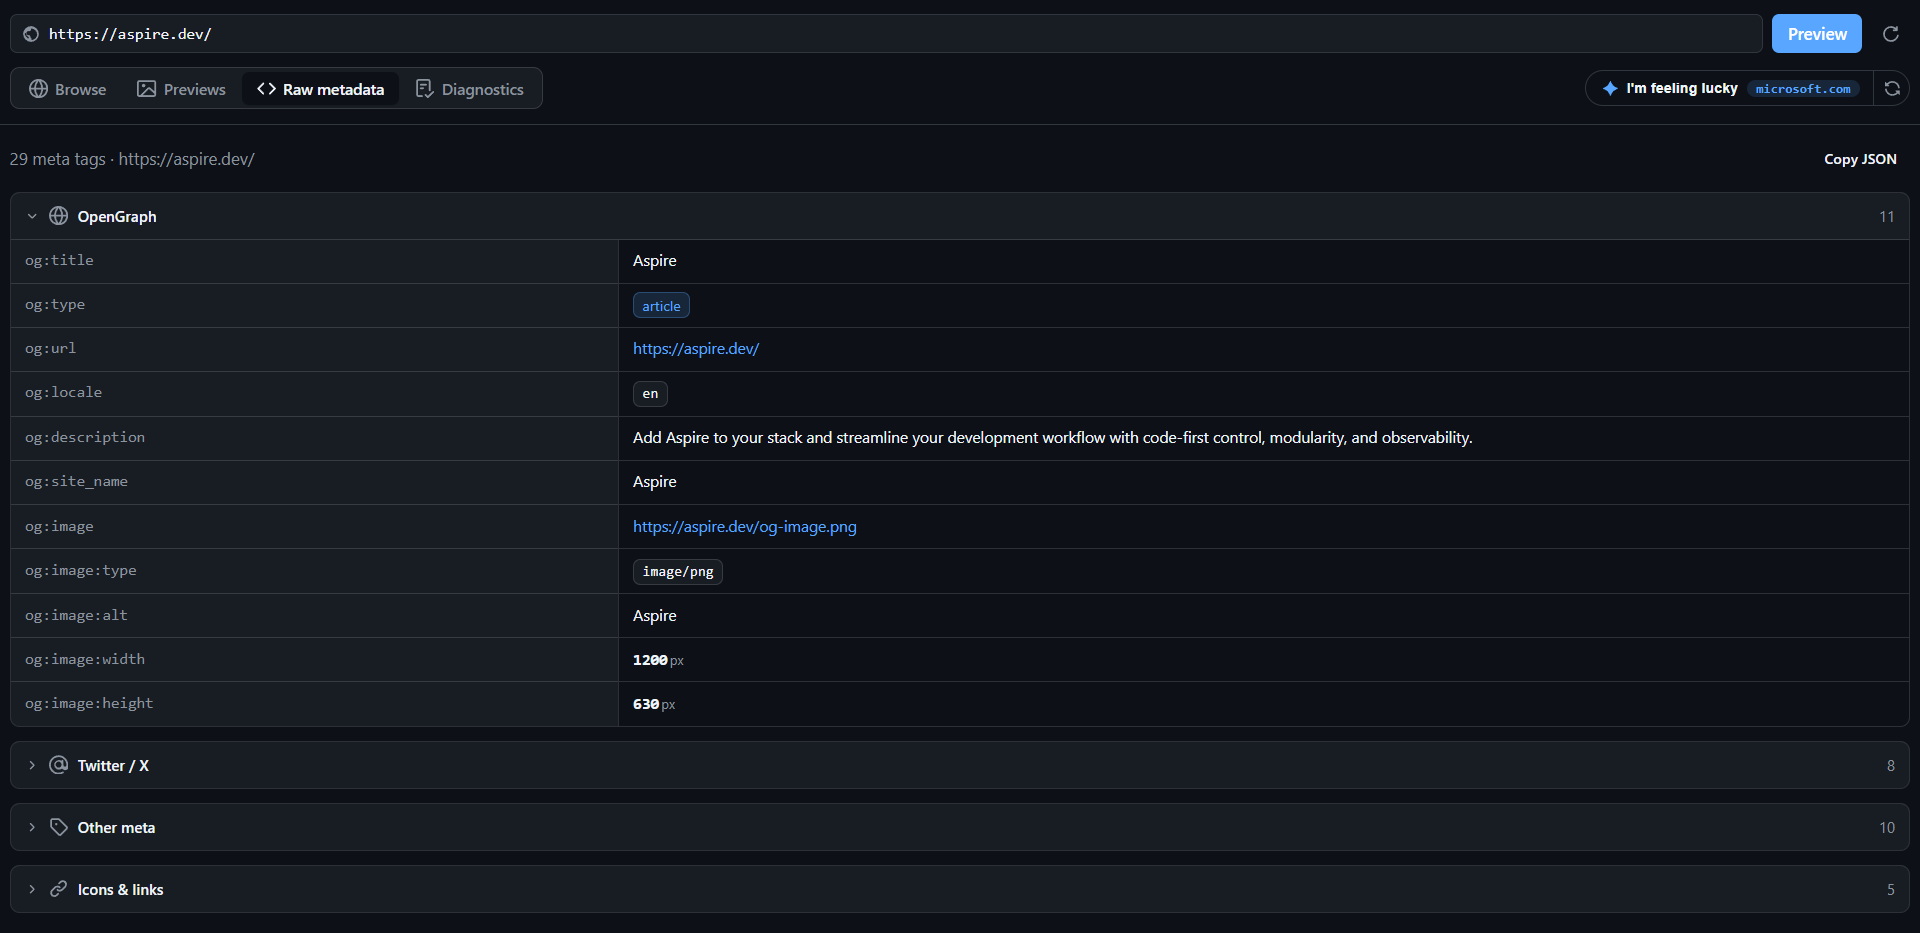
Aspire pages also emit git-commit-id and git-source-url. Hovering the source URL fetches the corresponding GitHub file and displays a scrollable, syntax-highlighted hovercard without leaving the canvas.
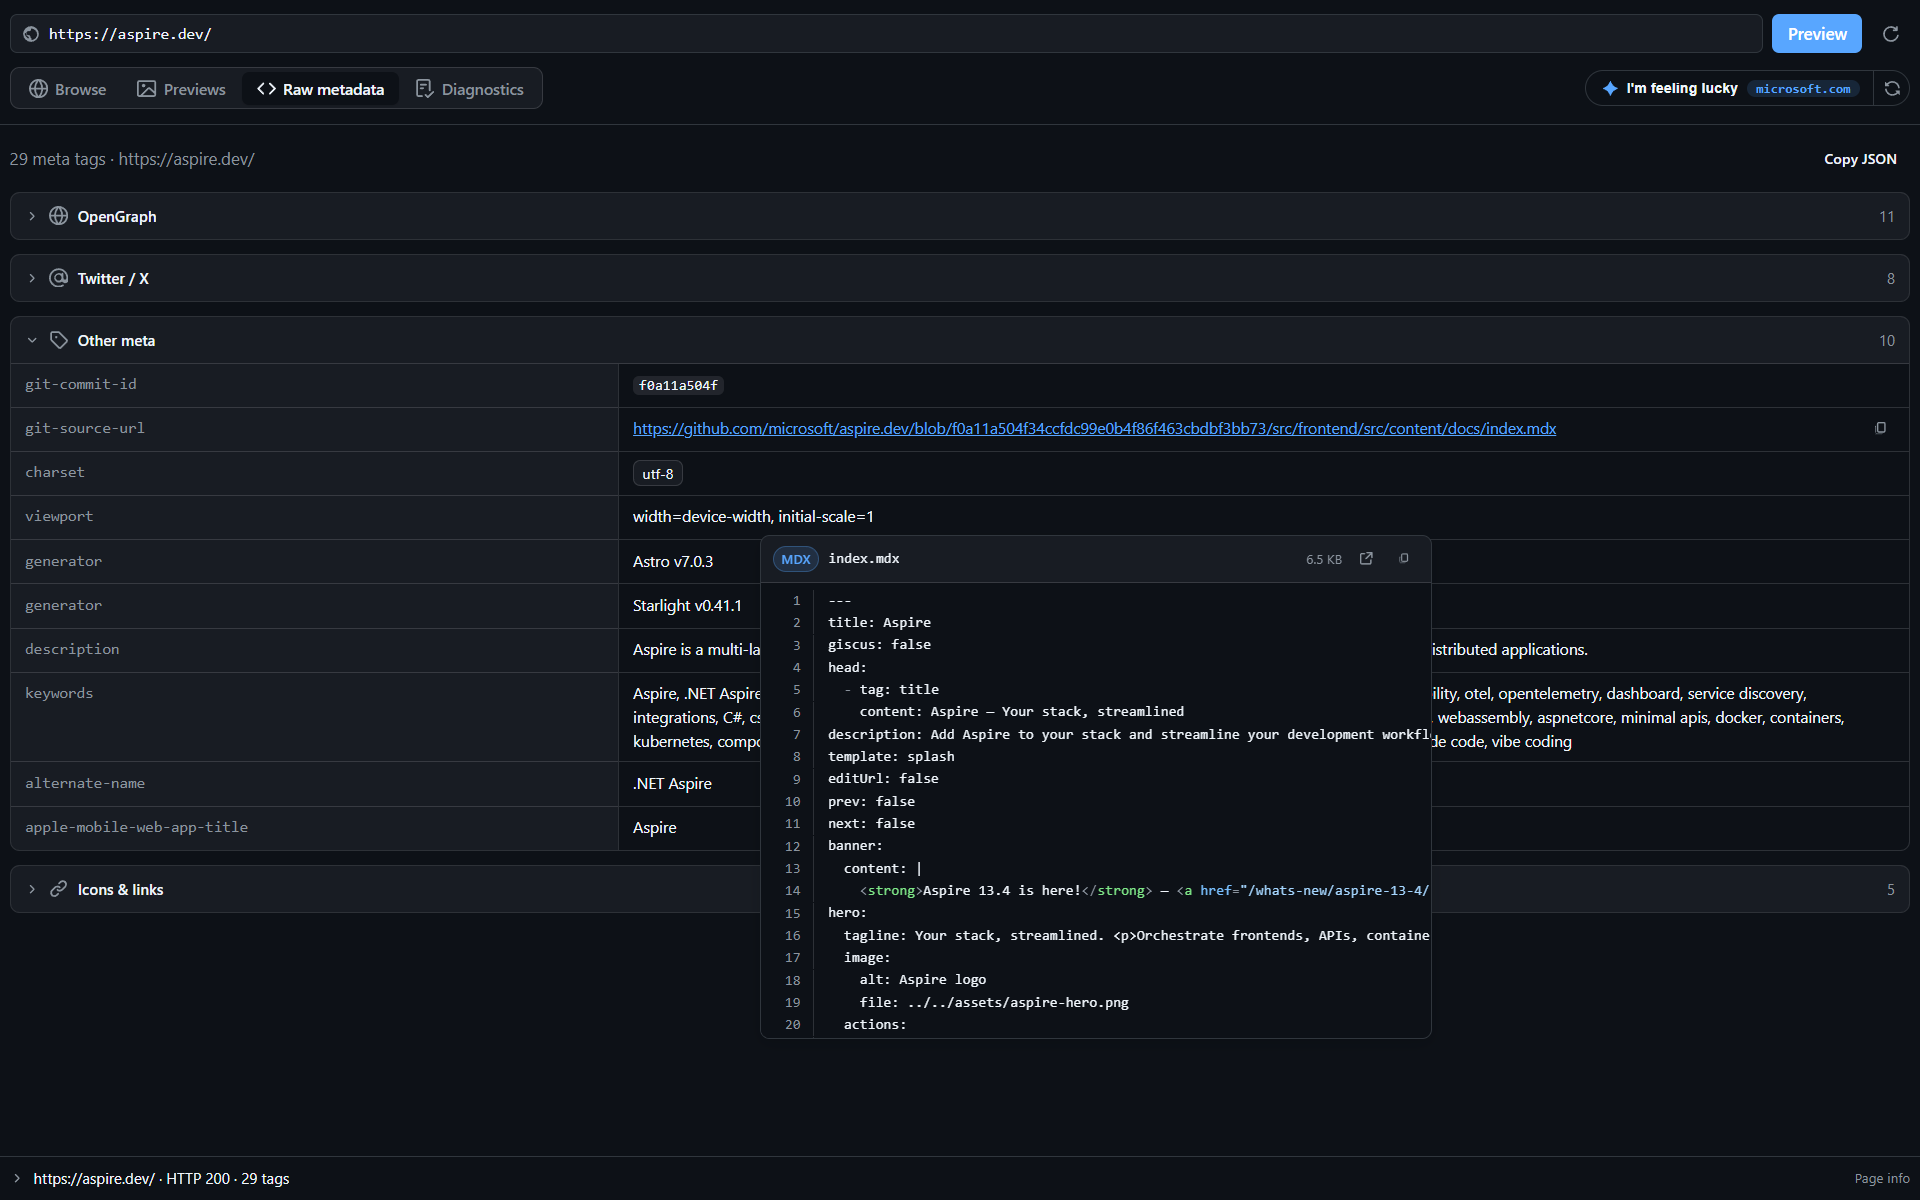
That connection from rendered page to source file is small but powerful. It removes the “which file generated this page?” step from the debugging loop.
Diagnose, explain, and act
The OpenGraph diagnostics check required, recommended, and optional metadata, including structured image properties:
og:title,og:type,og:url, andog:descriptionog:imageand whether its URL is absoluteog:image:alt, width, height, MIME type, and secure URLog:site_name,og:locale, andtwitter:card- Description length
I pointed the canvas at aspire.dev for this walkthrough. Instead of manufacturing a failure, the diagnostics confirmed that the site passes every displayed check: the core OpenGraph fields, site name and locale, X card metadata, absolute and secure image URLs, image alt text, declared dimensions, MIME type, and description length.
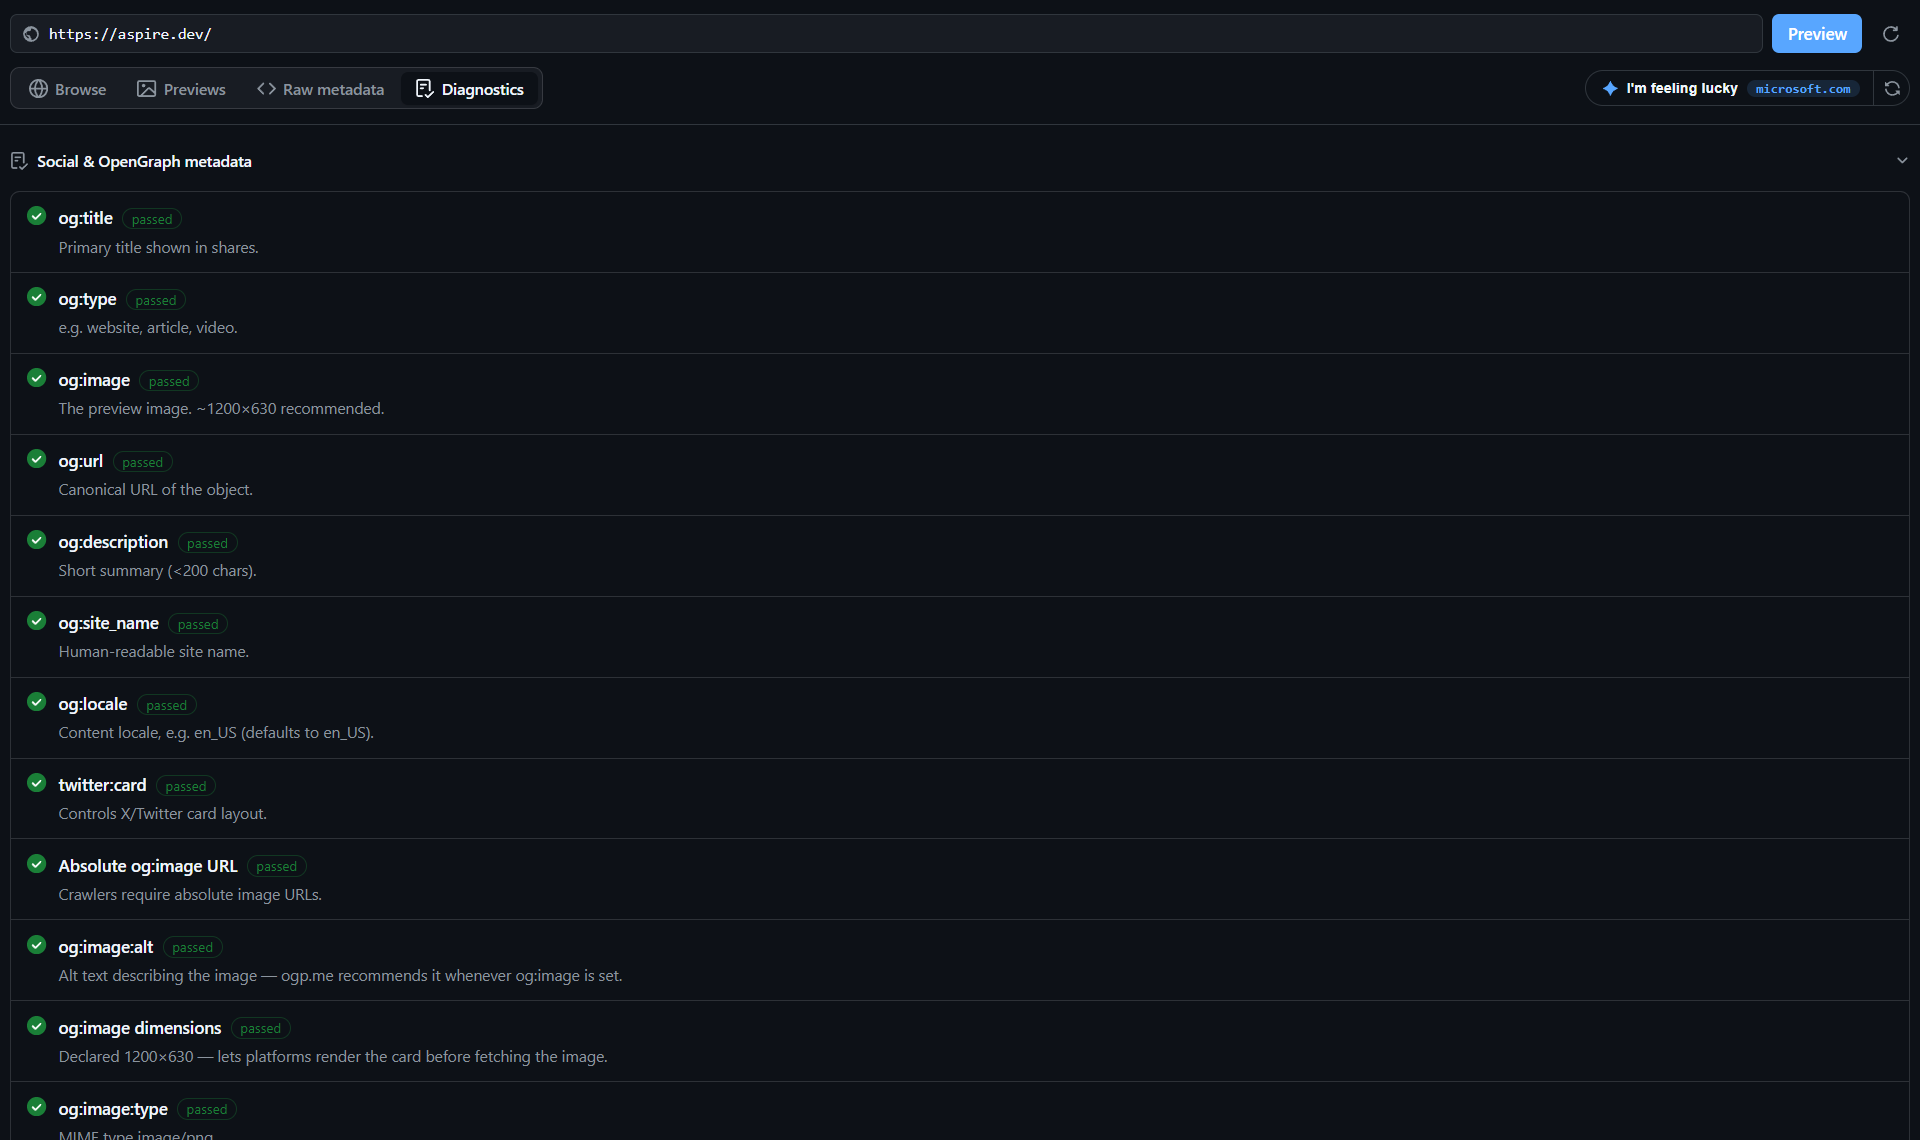
A clean report is useful evidence too: it confirms the metadata is complete before a platform crawler ever sees the page. The failure path is just as important, but it should not invent problems on a healthy site.
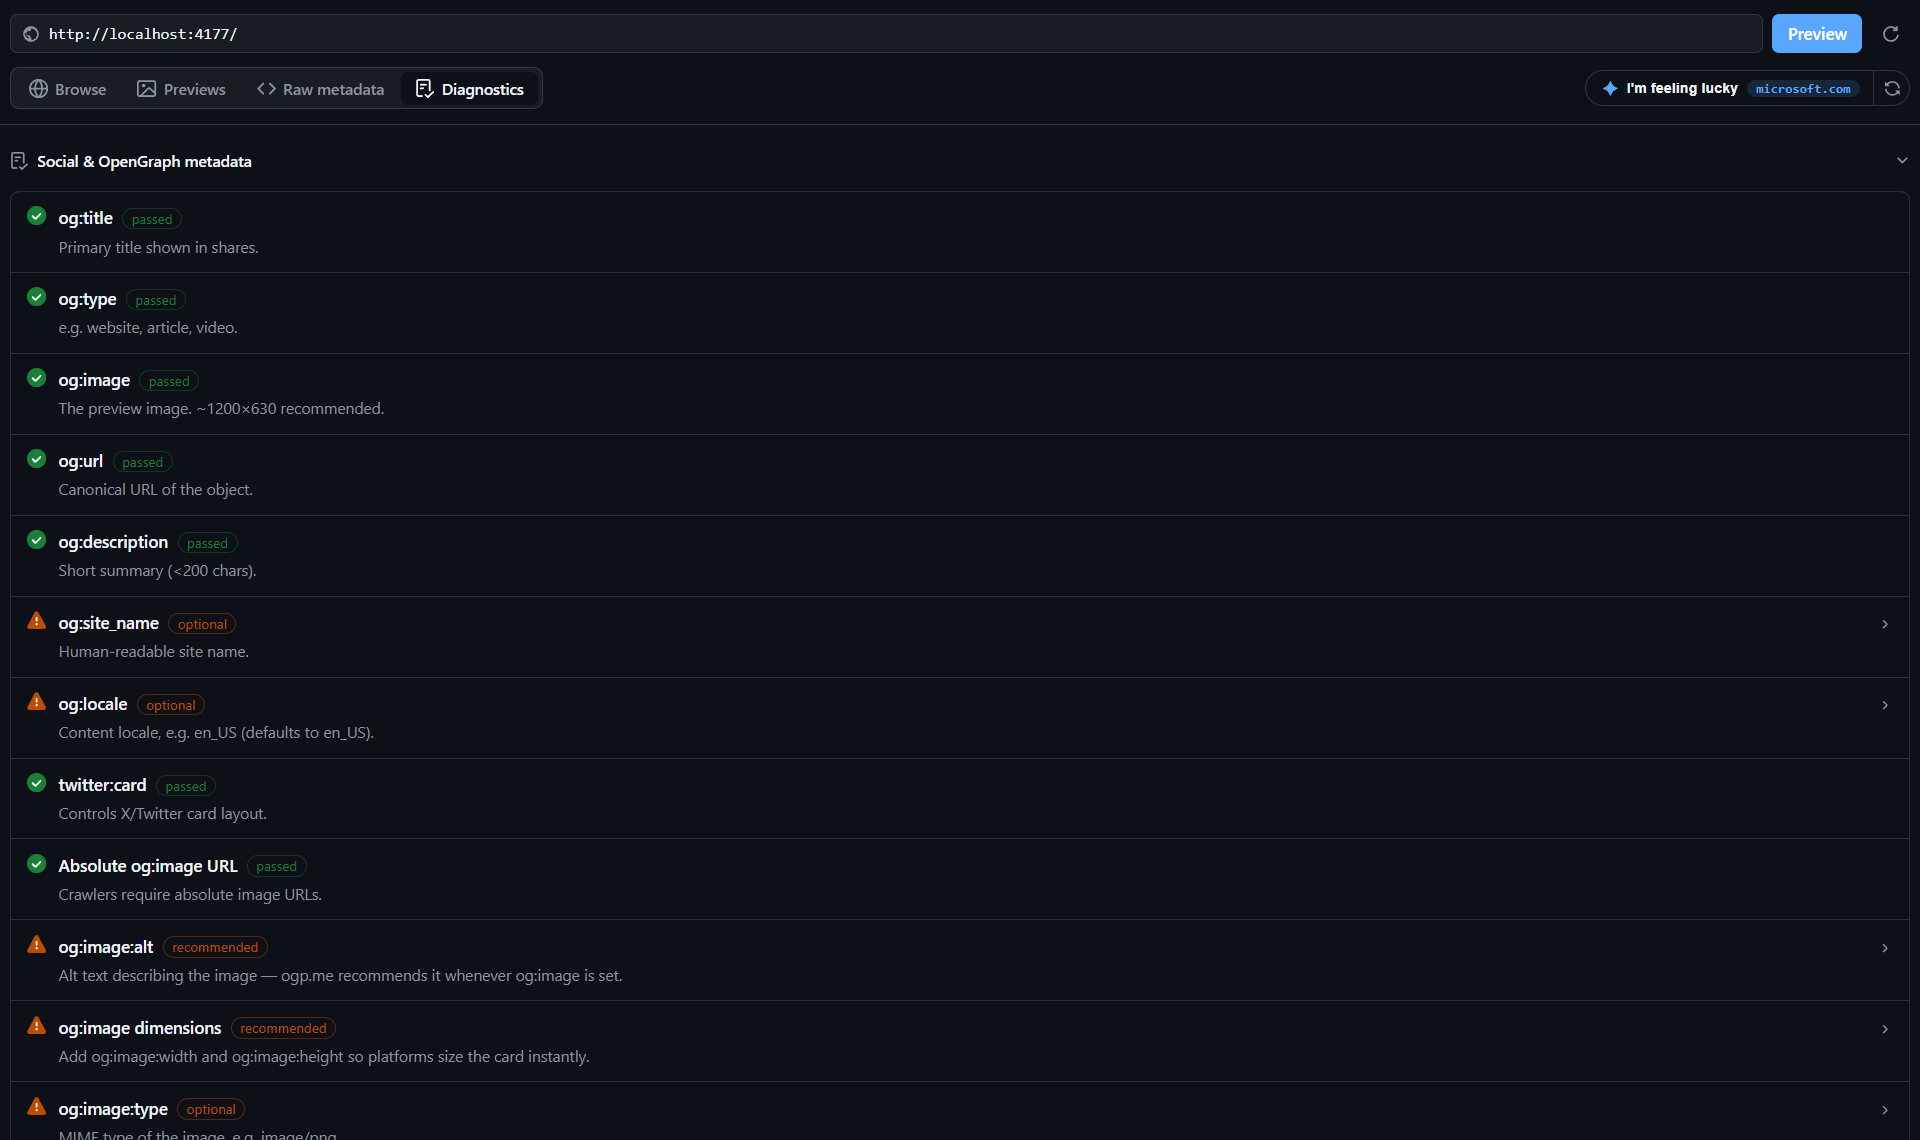
Expanding the missing og:image:alt check explains why it matters, shows the exact tag shape, links to the OpenGraph structured-properties reference, and produces a copyable AI fix prompt grounded in the local page.
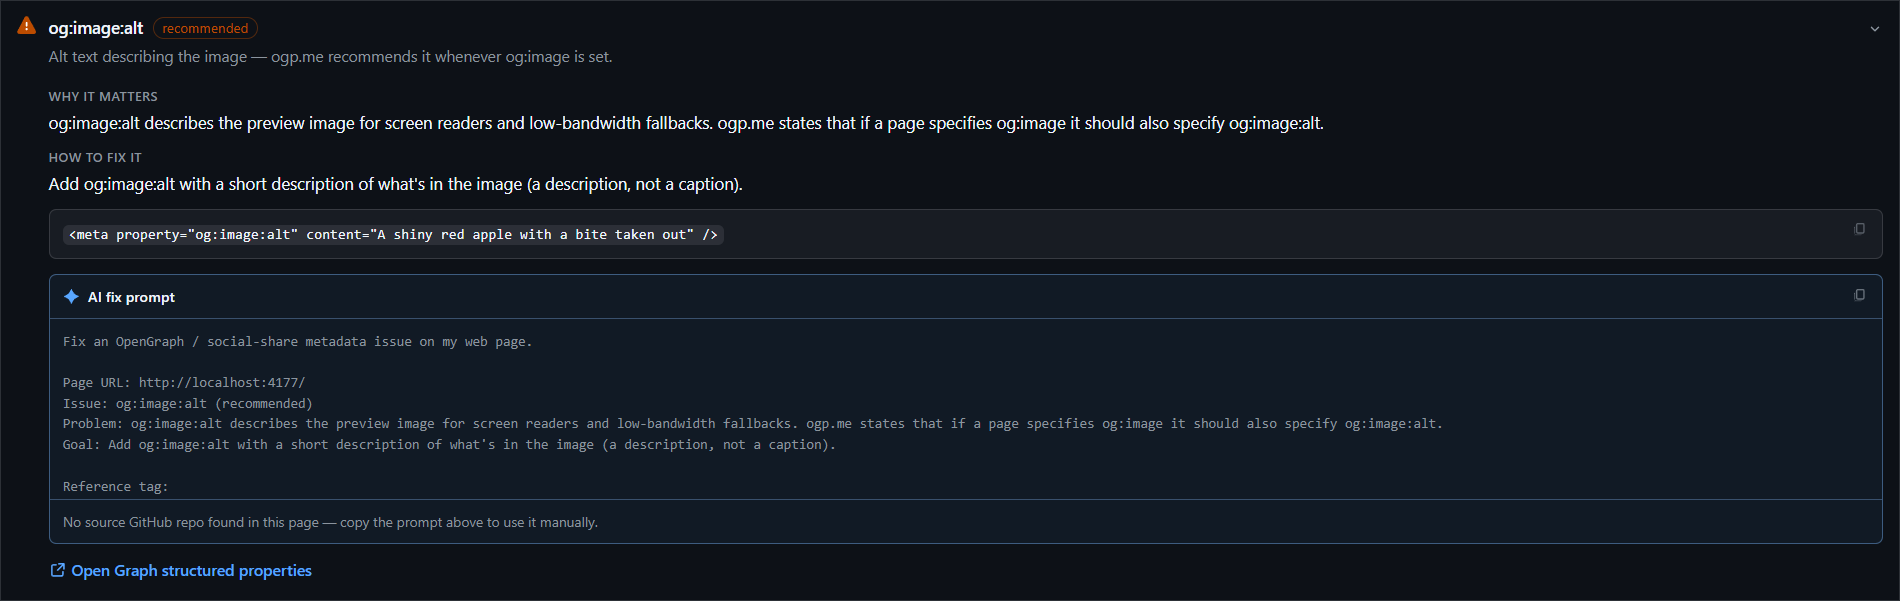
The fixture deliberately has no repository link, so the canvas does not guess - it leaves the prompt ready to copy manually. The repo-backed aspire.dev example below shows how the same remediation pattern can continue directly into Copilot or a GitHub issue.
Agent readiness is part of web readiness
OpenGraph metadata answers, “How will a person see this link?” The experimental Agent readiness section asks, “How will an agent discover, read, and act on this site?”
It runs 15 read-only checks across five groups:
| Group | Checks |
|---|---|
| Discoverability | robots.txt, XML sitemap, and response Link headers |
| Content for agents | llms.txt and Markdown content negotiation |
| Bot access control | AI crawler rules and Content Signals |
| Agent and protocol discovery | MCP, A2A, Agent Skills, AI plugin, and DNS-AID |
| Auth for agents | OAuth protected-resource metadata, authorization-server metadata, and API Catalog |
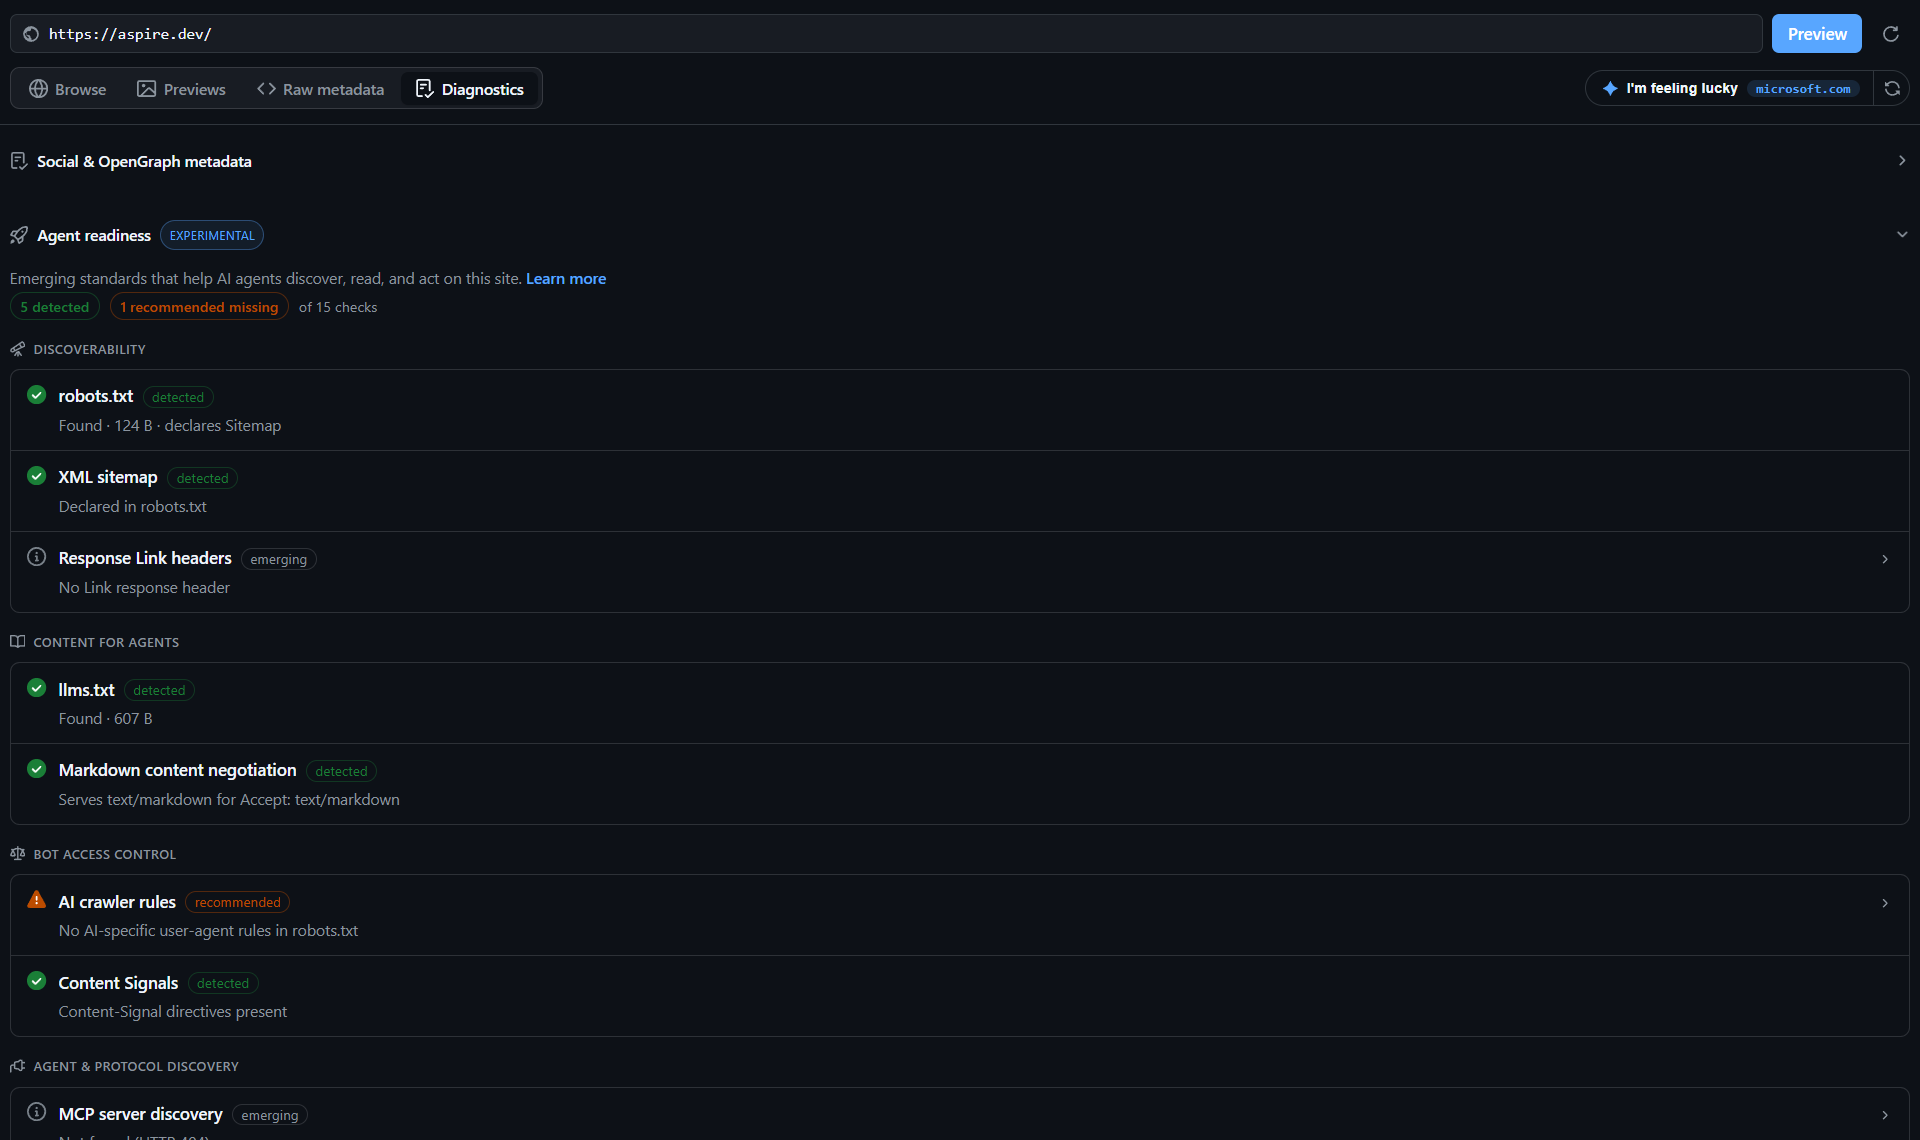
On aspire.dev, the audit detects the sitemap, llms.txt, Markdown negotiation, and Content Signals.
Expanding the missing AI crawler rules produces a focused prompt, detects microsoft/aspire.dev, and exposes the Copilot and issue actions.
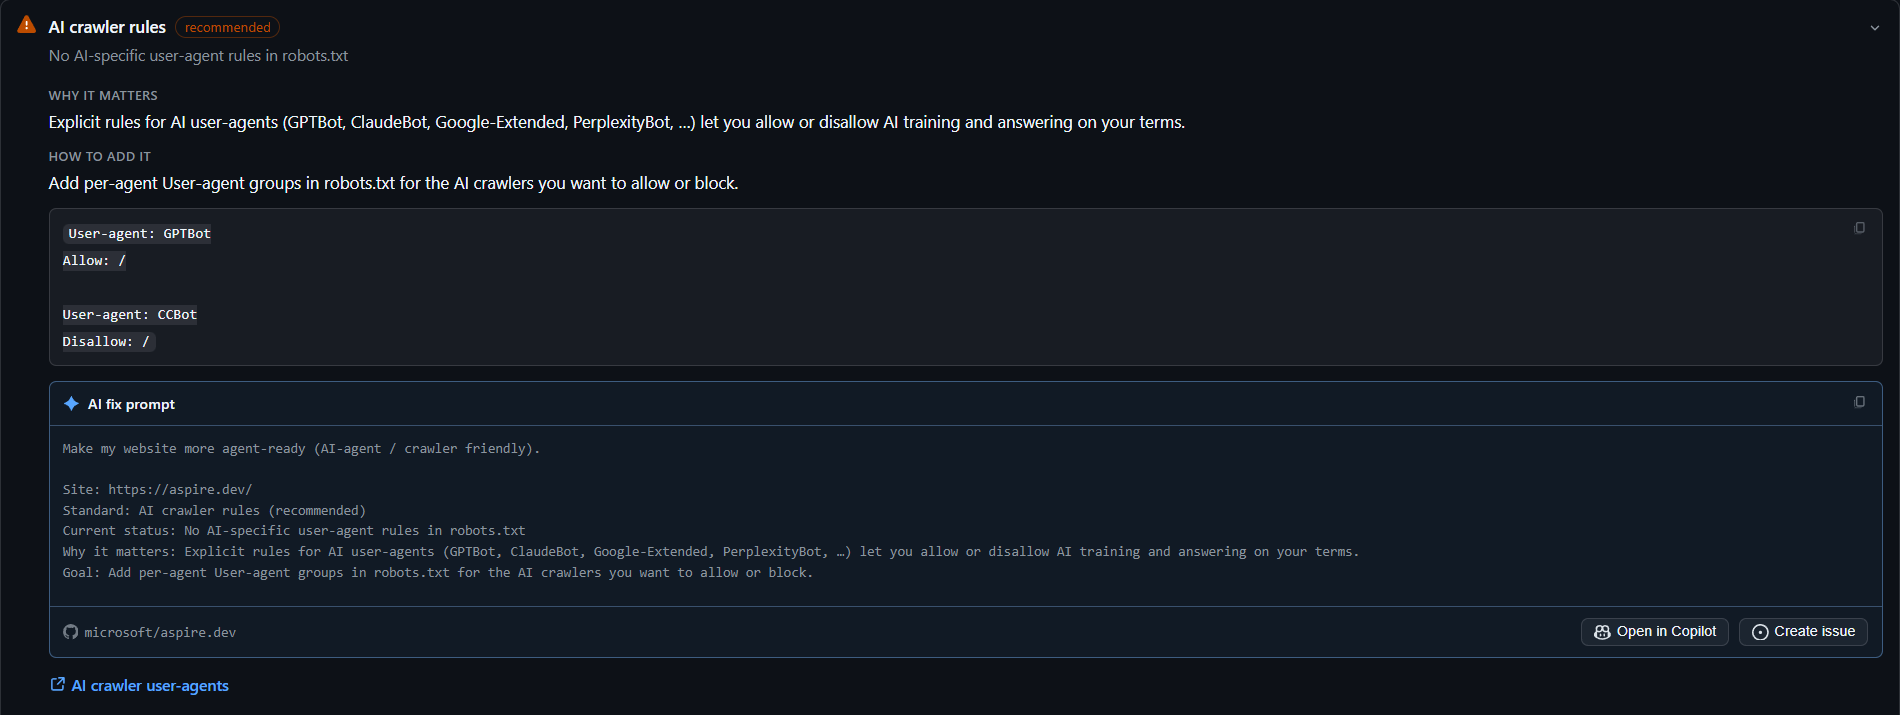
The remediation card includes two next actions:
- Open in Copilot starts a coding session for
microsoft/aspire.devwith the generated prompt already supplied. - Create issue files the recommendation in the repository and hands it to the Copilot coding agent.
Repository detection scores GitHub links in the fetched HTML. An “Edit this page” link is a strong signal; blob, tree, raw, and commit links are also considered. If the source cannot be identified confidently, the canvas does not guess - it leaves the prompt ready to copy manually.
Emerging standards are deliberately reported as informational rather than hard failures. That distinction matters: an absent experimental endpoint should not make a healthy site look broken.
The agent can drive the canvas too
The UI is only half of the collaboration model. The extension exposes one tool and two canvas actions:
| Capability | Purpose |
|---|---|
open_og_preview | Open or focus the canvas, optionally loading a URL immediately |
preview_url | Drive an open canvas to a URL and return the resolved preview fields |
get_metadata | Fetch and parse a URL headlessly, returning raw tags and diagnostics |
That means I can ask Copilot:
Open the OG preview for localhost:4321/posts/opengraph-preview-canvasThe human-visible canvas opens, while the agent can inspect the same structured result. Server-Sent Events keep agent-driven navigation synchronized with the open panel.
How the extension works
The implementation is dependency-free JavaScript with no build step. Each canvas instance gets a small HTTP server bound to 127.0.0.1 on a random port.
%3B%0A%20%20text%20%7B%20font-family%3A%20'Inter'%2C%20system-ui%2C%20sans-serif%3B%20%7D%0A%20%20svg%20%7B%0A%20%20%20%20%2F*%20Derived%20from%20--bg%20and%20--fg%20(overridable%20via%20--line%2C%20--accent%2C%20etc.)%20*%2F%0A%20%20%20%20--_text%3A%20%20%20%20%20%20%20%20%20%20var(--fg)%3B%0A%20%20%20%20--_text-sec%3A%20%20%20%20%20%20var(--muted%2C%20color-mix(in%20srgb%2C%20var(--fg)%2060%25%2C%20var(--bg)))%3B%0A%20%20%20%20--_text-muted%3A%20%20%20%20var(--muted%2C%20color-mix(in%20srgb%2C%20var(--fg)%2040%25%2C%20var(--bg)))%3B%0A%20%20%20%20--_text-faint%3A%20%20%20%20color-mix(in%20srgb%2C%20var(--fg)%2025%25%2C%20var(--bg))%3B%0A%20%20%20%20--_line%3A%20%20%20%20%20%20%20%20%20%20var(--line%2C%20color-mix(in%20srgb%2C%20var(--fg)%2030%25%2C%20var(--bg)))%3B%0A%20%20%20%20--_arrow%3A%20%20%20%20%20%20%20%20%20var(--accent%2C%20color-mix(in%20srgb%2C%20var(--fg)%2050%25%2C%20var(--bg)))%3B%0A%20%20%20%20--_node-fill%3A%20%20%20%20%20var(--surface%2C%20color-mix(in%20srgb%2C%20var(--fg)%203%25%2C%20var(--bg)))%3B%0A%20%20%20%20--_node-stroke%3A%20%20%20var(--border%2C%20color-mix(in%20srgb%2C%20var(--fg)%2020%25%2C%20var(--bg)))%3B%0A%20%20%20%20--_group-fill%3A%20%20%20%20var(--bg)%3B%0A%20%20%20%20--_group-hdr%3A%20%20%20%20%20color-mix(in%20srgb%2C%20var(--fg)%205%25%2C%20var(--bg))%3B%0A%20%20%20%20--_inner-stroke%3A%20%20color-mix(in%20srgb%2C%20var(--fg)%2012%25%2C%20var(--bg))%3B%0A%20%20%20%20--_key-badge%3A%20%20%20%20%20color-mix(in%20srgb%2C%20var(--fg)%2010%25%2C%20var(--bg))%3B%0A%20%20%7D%0A%3C%2Fstyle%3E%0A%3Cdefs%3E%0A%20%20%3Cmarker%20id%3D%22seq-arrow%22%20markerWidth%3D%228%22%20markerHeight%3D%224.8%22%20refX%3D%228%22%20refY%3D%222.4%22%20orient%3D%22auto-start-reverse%22%3E%0A%20%20%20%20%3Cpolygon%20points%3D%220%200%2C%208%202.4%2C%200%204.8%22%20fill%3D%22var(--_arrow)%22%20%2F%3E%0A%20%20%3C%2Fmarker%3E%0A%20%20%3Cmarker%20id%3D%22seq-arrow-open%22%20markerWidth%3D%228%22%20markerHeight%3D%224.8%22%20refX%3D%228%22%20refY%3D%222.4%22%20orient%3D%22auto-start-reverse%22%3E%0A%20%20%20%20%3Cpolyline%20points%3D%220%200%2C%208%202.4%2C%200%204.8%22%20fill%3D%22none%22%20stroke%3D%22var(--_arrow)%22%20stroke-width%3D%221%22%20%2F%3E%0A%20%20%3C%2Fmarker%3E%0A%3C%2Fdefs%3E%0A%3Cline%20x1%3D%2270%22%20y1%3D%2270%22%20x2%3D%2270%22%20y2%3D%22630%22%20stroke%3D%22var(--_line)%22%20stroke-width%3D%220.75%22%20stroke-dasharray%3D%226%204%22%20%2F%3E%0A%3Cline%20x1%3D%22210%22%20y1%3D%2270%22%20x2%3D%22210%22%20y2%3D%22630%22%20stroke%3D%22var(--_line)%22%20stroke-width%3D%220.75%22%20stroke-dasharray%3D%226%204%22%20%2F%3E%0A%3Cline%20x1%3D%22357.07500000000005%22%20y1%3D%2270%22%20x2%3D%22357.07500000000005%22%20y2%3D%22630%22%20stroke%3D%22var(--_line)%22%20stroke-width%3D%220.75%22%20stroke-dasharray%3D%226%204%22%20%2F%3E%0A%3Cline%20x1%3D%22522.0250000000001%22%20y1%3D%2270%22%20x2%3D%22522.0250000000001%22%20y2%3D%22630%22%20stroke%3D%22var(--_line)%22%20stroke-width%3D%220.75%22%20stroke-dasharray%3D%226%204%22%20%2F%3E%0A%3Cline%20x1%3D%22690.5500000000001%22%20y1%3D%2270%22%20x2%3D%22690.5500000000001%22%20y2%3D%22630%22%20stroke%3D%22var(--_line)%22%20stroke-width%3D%220.75%22%20stroke-dasharray%3D%226%204%22%20%2F%3E%0A%3Cline%20x1%3D%22855.5%22%20y1%3D%2270%22%20x2%3D%22855.5%22%20y2%3D%22630%22%20stroke%3D%22var(--_line)%22%20stroke-width%3D%220.75%22%20stroke-dasharray%3D%226%204%22%20%2F%3E%0A%3Cline%20x1%3D%2270%22%20y1%3D%2290%22%20x2%3D%22210%22%20y2%3D%2290%22%20stroke%3D%22var(--_line)%22%20stroke-width%3D%220.75%22%20marker-end%3D%22url(%23seq-arrow)%22%20%2F%3E%0A%3Ctext%20x%3D%22140%22%20y%3D%2284%22%20text-anchor%3D%22middle%22%20font-size%3D%2211%22%20font-weight%3D%22400%22%20fill%3D%22var(--_text-muted)%22%3EPreview%20localhost%3A4321%3C%2Ftext%3E%0A%3Cline%20x1%3D%22210%22%20y1%3D%22130%22%20x2%3D%22357.07500000000005%22%20y2%3D%22130%22%20stroke%3D%22var(--_line)%22%20stroke-width%3D%220.75%22%20marker-end%3D%22url(%23seq-arrow)%22%20%2F%3E%0A%3Ctext%20x%3D%22283.5375%22%20y%3D%22124%22%20text-anchor%3D%22middle%22%20font-size%3D%2211%22%20font-weight%3D%22400%22%20fill%3D%22var(--_text-muted)%22%3Eopen_og_preview(url)%3C%2Ftext%3E%0A%3Cline%20x1%3D%22357.07500000000005%22%20y1%3D%22170%22%20x2%3D%22522.0250000000001%22%20y2%3D%22170%22%20stroke%3D%22var(--_line)%22%20stroke-width%3D%220.75%22%20marker-end%3D%22url(%23seq-arrow)%22%20%2F%3E%0A%3Ctext%20x%3D%22439.55000000000007%22%20y%3D%22164%22%20text-anchor%3D%22middle%22%20font-size%3D%2211%22%20font-weight%3D%22400%22%20fill%3D%22var(--_text-muted)%22%3Ecanvas.open%3C%2Ftext%3E%0A%3Cpolyline%20points%3D%22522.0250000000001%2C210%20552.0250000000001%2C210%20552.0250000000001%2C230%20522.0250000000001%2C230%22%20fill%3D%22none%22%20stroke%3D%22var(--_line)%22%20stroke-width%3D%220.75%22%20marker-end%3D%22url(%23seq-arrow)%22%20%2F%3E%0A%3Ctext%20x%3D%22558.0250000000001%22%20y%3D%22220%22%20dy%3D%220.35em%22%20font-size%3D%2211%22%20font-weight%3D%22400%22%20fill%3D%22var(--_text-muted)%22%3EStart%20127.0.0.1%20server%3C%2Ftext%3E%0A%3Cline%20x1%3D%22522.0250000000001%22%20y1%3D%22280%22%20x2%3D%22357.07500000000005%22%20y2%3D%22280%22%20stroke%3D%22var(--_line)%22%20stroke-width%3D%220.75%22%20stroke-dasharray%3D%226%204%22%20marker-end%3D%22url(%23seq-arrow)%22%20%2F%3E%0A%3Ctext%20x%3D%22439.55000000000007%22%20y%3D%22274%22%20text-anchor%3D%22middle%22%20font-size%3D%2211%22%20font-weight%3D%22400%22%20fill%3D%22var(--_text-muted)%22%3ERenderer%20URL%3C%2Ftext%3E%0A%3Cline%20x1%3D%22357.07500000000005%22%20y1%3D%22320%22%20x2%3D%22690.5500000000001%22%20y2%3D%22320%22%20stroke%3D%22var(--_line)%22%20stroke-width%3D%220.75%22%20marker-end%3D%22url(%23seq-arrow)%22%20%2F%3E%0A%3Ctext%20x%3D%22523.8125%22%20y%3D%22314%22%20text-anchor%3D%22middle%22%20font-size%3D%2211%22%20font-weight%3D%22400%22%20fill%3D%22var(--_text-muted)%22%3EOpen%20side%20panel%3C%2Ftext%3E%0A%3Cline%20x1%3D%22690.5500000000001%22%20y1%3D%22360%22%20x2%3D%22522.0250000000001%22%20y2%3D%22360%22%20stroke%3D%22var(--_line)%22%20stroke-width%3D%220.75%22%20marker-end%3D%22url(%23seq-arrow)%22%20%2F%3E%0A%3Ctext%20x%3D%22606.2875000000001%22%20y%3D%22354%22%20text-anchor%3D%22middle%22%20font-size%3D%2211%22%20font-weight%3D%22400%22%20fill%3D%22var(--_text-muted)%22%3EGET%20%2Fapi%2Ffetch%3Fu%3D...%3C%2Ftext%3E%0A%3Cline%20x1%3D%22522.0250000000001%22%20y1%3D%22400%22%20x2%3D%22855.5%22%20y2%3D%22400%22%20stroke%3D%22var(--_line)%22%20stroke-width%3D%220.75%22%20marker-end%3D%22url(%23seq-arrow)%22%20%2F%3E%0A%3Ctext%20x%3D%22688.7625%22%20y%3D%22394%22%20text-anchor%3D%22middle%22%20font-size%3D%2211%22%20font-weight%3D%22400%22%20fill%3D%22var(--_text-muted)%22%3EFetch%20HTML%3C%2Ftext%3E%0A%3Cline%20x1%3D%22855.5%22%20y1%3D%22440%22%20x2%3D%22522.0250000000001%22%20y2%3D%22440%22%20stroke%3D%22var(--_line)%22%20stroke-width%3D%220.75%22%20stroke-dasharray%3D%226%204%22%20marker-end%3D%22url(%23seq-arrow)%22%20%2F%3E%0A%3Ctext%20x%3D%22688.7625%22%20y%3D%22434%22%20text-anchor%3D%22middle%22%20font-size%3D%2211%22%20font-weight%3D%22400%22%20fill%3D%22var(--_text-muted)%22%3EHTML%20%2B%20headers%3C%2Ftext%3E%0A%3Cpolyline%20points%3D%22522.0250000000001%2C480%20552.0250000000001%2C480%20552.0250000000001%2C500%20522.0250000000001%2C500%22%20fill%3D%22none%22%20stroke%3D%22var(--_line)%22%20stroke-width%3D%220.75%22%20marker-end%3D%22url(%23seq-arrow)%22%20%2F%3E%0A%3Ctext%20x%3D%22558.0250000000001%22%20y%3D%22490%22%20dy%3D%220.35em%22%20font-size%3D%2211%22%20font-weight%3D%22400%22%20fill%3D%22var(--_text-muted)%22%3EParse%20metadata%20%2B%20diagnostics%3C%2Ftext%3E%0A%3Cline%20x1%3D%22522.0250000000001%22%20y1%3D%22550%22%20x2%3D%22690.5500000000001%22%20y2%3D%22550%22%20stroke%3D%22var(--_line)%22%20stroke-width%3D%220.75%22%20stroke-dasharray%3D%226%204%22%20marker-end%3D%22url(%23seq-arrow)%22%20%2F%3E%0A%3Ctext%20x%3D%22606.2875000000001%22%20y%3D%22544%22%20text-anchor%3D%22middle%22%20font-size%3D%2211%22%20font-weight%3D%22400%22%20fill%3D%22var(--_text-muted)%22%3EStructured%20JSON%3C%2Ftext%3E%0A%3Cline%20x1%3D%22522.0250000000001%22%20y1%3D%22590%22%20x2%3D%22690.5500000000001%22%20y2%3D%22590%22%20stroke%3D%22var(--_line)%22%20stroke-width%3D%220.75%22%20stroke-dasharray%3D%226%204%22%20marker-end%3D%22url(%23seq-arrow)%22%20%2F%3E%0A%3Ctext%20x%3D%22606.2875000000001%22%20y%3D%22584%22%20text-anchor%3D%22middle%22%20font-size%3D%2211%22%20font-weight%3D%22400%22%20fill%3D%22var(--_text-muted)%22%3ESSE%20updates%20for%20agent%20navigation%3C%2Ftext%3E%0A%3Cg%20transform%3D%22translate(52%2C32)%20scale(1.5)%22%3E%0A%20%20%3Cpath%20d%3D%22M21%2012C21%2016.9706%2016.9706%2021%2012%2021C7.02944%2021%203%2016.9706%203%2012C3%207.02944%207.02944%203%2012%203C16.9706%203%2021%207.02944%2021%2012Z%22%20fill%3D%22none%22%20stroke%3D%22var(--_line)%22%20stroke-width%3D%220.6666666666666666%22%20%2F%3E%0A%20%20%3Cpath%20d%3D%22M15%2010C15%2011.6569%2013.6569%2013%2012%2013C10.3431%2013%209%2011.6569%209%2010C9%208.34315%2010.3431%207%2012%207C13.6569%207%2015%208.34315%2015%2010Z%22%20fill%3D%22none%22%20stroke%3D%22var(--_line)%22%20stroke-width%3D%220.6666666666666666%22%20%2F%3E%0A%20%20%3Cpath%20d%3D%22M5.62842%2018.3563C7.08963%2017.0398%209.39997%2016%2012%2016C14.6%2016%2016.9104%2017.0398%2018.3716%2018.3563%22%20fill%3D%22none%22%20stroke%3D%22var(--_line)%22%20stroke-width%3D%220.6666666666666666%22%20%2F%3E%0A%3C%2Fg%3E%0A%3Ctext%20x%3D%2270%22%20y%3D%2284%22%20text-anchor%3D%22middle%22%20font-size%3D%2213%22%20font-weight%3D%22500%22%20fill%3D%22var(--_text)%22%3EHuman%3C%2Ftext%3E%0A%3Crect%20x%3D%22168.975%22%20y%3D%2230%22%20width%3D%2282.05000000000001%22%20height%3D%2240%22%20rx%3D%224%22%20ry%3D%224%22%20fill%3D%22var(--_node-fill)%22%20stroke%3D%22var(--_node-stroke)%22%20stroke-width%3D%221%22%20%2F%3E%0A%3Ctext%20x%3D%22210%22%20y%3D%2250%22%20text-anchor%3D%22middle%22%20dy%3D%220.35em%22%20font-size%3D%2213%22%20font-weight%3D%22500%22%20fill%3D%22var(--_text)%22%3ECopilot%3C%2Ftext%3E%0A%3Crect%20x%3D%22291.02500000000003%22%20y%3D%2230%22%20width%3D%22132.10000000000002%22%20height%3D%2240%22%20rx%3D%224%22%20ry%3D%224%22%20fill%3D%22var(--_node-fill)%22%20stroke%3D%22var(--_node-stroke)%22%20stroke-width%3D%221%22%20%2F%3E%0A%3Ctext%20x%3D%22357.07500000000005%22%20y%3D%2250%22%20text-anchor%3D%22middle%22%20dy%3D%220.35em%22%20font-size%3D%2213%22%20font-weight%3D%22500%22%20fill%3D%22var(--_text)%22%3ECanvas%20runtime%3C%2Ftext%3E%0A%3Crect%20x%3D%22463.1250000000001%22%20y%3D%2230%22%20width%3D%22117.80000000000001%22%20height%3D%2240%22%20rx%3D%224%22%20ry%3D%224%22%20fill%3D%22var(--_node-fill)%22%20stroke%3D%22var(--_node-stroke)%22%20stroke-width%3D%221%22%20%2F%3E%0A%3Ctext%20x%3D%22522.0250000000001%22%20y%3D%2250%22%20text-anchor%3D%22middle%22%20dy%3D%220.35em%22%20font-size%3D%2213%22%20font-weight%3D%22500%22%20fill%3D%22var(--_text)%22%3EOG%20extension%3C%2Ftext%3E%0A%3Crect%20x%3D%22620.9250000000001%22%20y%3D%2230%22%20width%3D%22139.25%22%20height%3D%2240%22%20rx%3D%224%22%20ry%3D%224%22%20fill%3D%22var(--_node-fill)%22%20stroke%3D%22var(--_node-stroke)%22%20stroke-width%3D%221%22%20%2F%3E%0A%3Ctext%20x%3D%22690.5500000000001%22%20y%3D%2250%22%20text-anchor%3D%22middle%22%20dy%3D%220.35em%22%20font-size%3D%2213%22%20font-weight%3D%22500%22%20fill%3D%22var(--_text)%22%3ECanvas%20renderer%3C%2Ftext%3E%0A%3Crect%20x%3D%22800.175%22%20y%3D%2230%22%20width%3D%22110.65%22%20height%3D%2240%22%20rx%3D%224%22%20ry%3D%224%22%20fill%3D%22var(--_node-fill)%22%20stroke%3D%22var(--_node-stroke)%22%20stroke-width%3D%221%22%20%2F%3E%0A%3Ctext%20x%3D%22855.5%22%20y%3D%2250%22%20text-anchor%3D%22middle%22%20dy%3D%220.35em%22%20font-size%3D%2213%22%20font-weight%3D%22500%22%20fill%3D%22var(--_text)%22%3ETarget%20page%3C%2Ftext%3E%0A%3C%2Fsvg%3E)
The key pieces are:
extension.mjswires the canvas, actions, loopback routes, browsing proxy, and session handoffs.http-fetch.mjshandles redirects, timeouts, response limits, and network safety.parse-og.mjsresolves tags, URLs, social fields, repository clues, and diagnostics.agent-readiness.mjsprobes the emerging agent-facing standards.- The
uidirectory contains the renderer, platform cards, interactions, theme support, and loading states.
Server-side fetching solves two important problems. It avoids browser CORS restrictions, and it makes localhost reachable from the extension process. The interactive Browse tab uses a script-rewriting proxy so styles, modules, fonts, and internal navigation continue working inside an opaque-origin sandbox.
Safety and accessibility are part of the design
Fetching arbitrary URLs from an agent-driven canvas requires deliberate guardrails:
- Oversized responses are rejected immediately, and stream completion is guarded against double settlement.
- Relative canonical, image, and metadata URLs are resolved against the fetched page URL before they reach the UI.
- The four tabs expose selection state and panel relationships, use roving focus, and support keyboard navigation.
- Every destination and redirect hop is validated. Private, link-local, CGNAT, and cloud-metadata ranges are blocked, while loopback remains available for the core local-preview scenario. Private networks require an explicit
OG_ALLOW_PRIVATE_NETWORK=1opt-in.
That last tradeoff is especially important. “Supports localhost” should not mean “silently turns the agent into a network scanner.”
Why this changes the feedback loop
| Before | With the canvas |
|---|---|
| Deploy before validating | Preview localhost before deployment |
| Open separate platform validators | Compare nine renderings together |
Inspect <head> manually | Review grouped, copyable metadata |
| Translate a warning into work | Generate a grounded fix prompt |
| Find the owning repository | Detect it from the page |
| Copy context into another tool | Open a Copilot session or create an issue |
| Audit social metadata separately | Include agent readiness in the same workflow |
The real value is not the card renderer by itself. It is the shortened distance between seeing a problem, understanding it, and starting the correct fix in the correct repository.
Try it yourself
Start by installing the GitHub Copilot app.
The extension is open source in the Aspire docs repository. It is self-contained, uses the documented GitHub Copilot app theme tokens, and has no package installation or compilation step.
Read the official canvas extension documentation, copy or adapt the extension for your own workflow, and then ask Copilot to open a public or local URL.
Better social cards are the immediate payoff. The more interesting outcome is a reusable pattern: give humans and agents the same visible artifact, the same structured evidence, and an explicit path from diagnosis to action.
Comments
Questions, corrections, and additions are welcome. Sign in with GitHub to join the discussion.